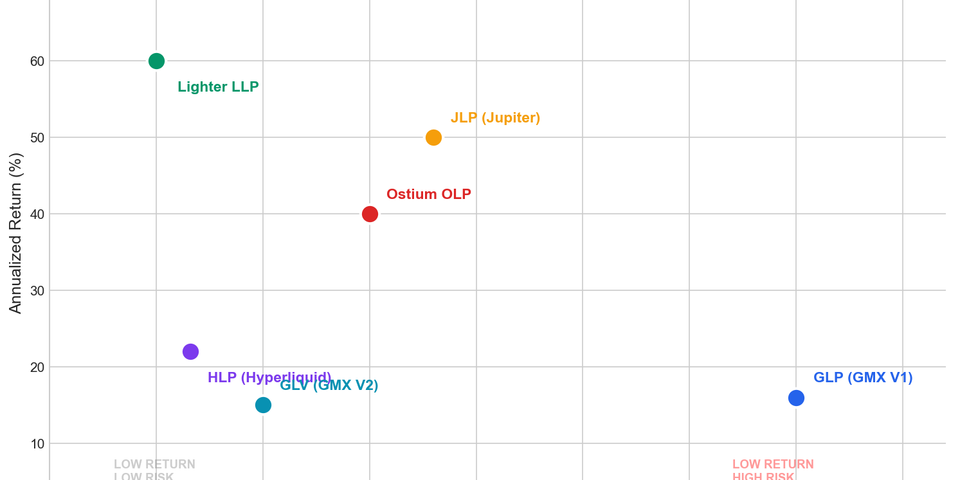
JLP Deep Dive: Where Does Your Yield Actually Come From?
Jupiter Perpetuals' liquidity pool token — JLP (Jupiter Liquidity Provider) — peaked at 124% APY in 2024 and attracted billions in capital, with TVL briefly crossing $3 billion in mid-2025. But most people's mental model of JLP is dangerously incomplete.
Most holders think of JLP as "stake and earn fees." That misses two-thirds of the picture. JLP has three distinct return components, each with its own risk logic. Critically, Jupiter's displayed APY only reflects one of them. Not understanding the other two is like driving on the highway with the dashboard covered.
This article breaks down all three return sources in detail — including the fee mechanics, the delta exposure structure, on-chain trader data, and what the JLP holder base actually looks like.
What JLP Actually Is: An Active Risk-Bearing Index Fund
JLP is not a passive staking receipt. It's designed to make holders the collective counterparty (the house) to every leveraged trader on Jupiter Perpetuals.
The pool holds five assets with target weights:
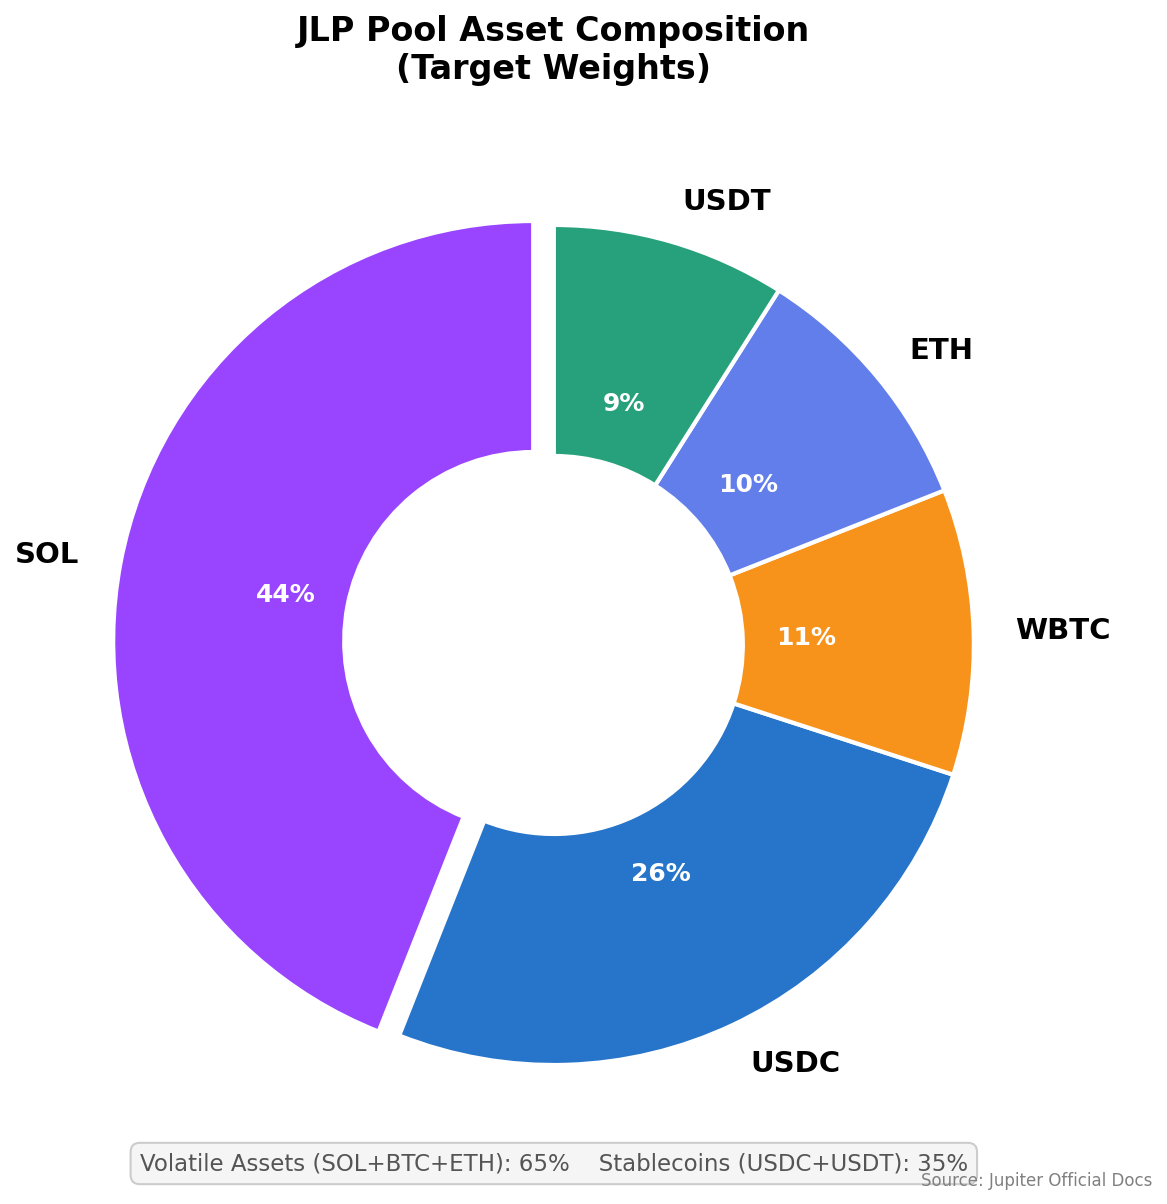
- SOL: 44%
- USDC: 26%
- WBTC: 11%
- ETH: 10%
- USDT: 9%
About 65% is volatile crypto, 35% is stablecoins. JLP's token price is simply:
JLP Price = Total Pool AUM (USD) / Total JLP Supply
When pool AUM increases, JLP price goes up. When AUM decreases, JLP price goes down. Three fundamentally different mechanisms drive AUM changes.
Return Component 1: Basket Price Exposure (Delta)
The most intuitive component. Holding JLP means you're indirectly long SOL, BTC, and ETH. According to OnChainTimes, every 0.45 of SOL exposure.
This works like a crypto ETF: SOL up means JLP up, SOL down means JLP down — just dampened by the 35% stablecoin buffer. The pool enforces target weights via fee incentives: deposits that push an asset away from its target pay higher fees, deposits that move it toward target get a discount. This creates organic rebalancing without forced selling.
Risk and reward of this component:
- In 2024's bull run, SOL's appreciation drove meaningful JLP AUM gains
- A sharp crypto downturn directly hits JLP NAV proportionally to its volatile asset weighting
- This component is not reflected in Jupiter's displayed APY
Return Component 2: Counterparty P&L
This is JLP's most distinctive — and most commonly overlooked — component.
The House Mechanic
When a trader opens a leveraged long on SOL, they're effectively borrowing SOL from the JLP pool. If SOL rises, the pool pays out the trader's profit (AUM decreases). If SOL falls, the trader's loss stays in the pool (AUM increases).
It's a zero-sum relationship: trader P&L directly offsets JLP's AUM in the opposite direction.
Historical Data: How Often Does the House Win?
The numbers are striking:
- Jan–Aug 2024: Traders collectively earned 136.8M in fees to JLP. That's a 37:1 ratio in JLP's favor.
- Week of Feb 10, 2026: High volatility week. Traders lost a net $29.7M that week — flowing directly into the pool.
- Every single week across all of Jupiter's public weekly reports shows negative net realized P&L for traders. The house wins every week.
This isn't coincidence. It's structural: most retail perpetual traders lose money over time, and JLP is positioned to benefit from exactly this statistical regularity.
That said, this edge isn't permanent. In a sustained, strong bull market where traders hold large profitable long positions, this component can turn negative for JLP.
This component is also not reflected in the displayed APY.
Return Component 3: Trading Fees (The Only APY Component)
This is the only thing Jupiter's APY figure actually measures.
APY Formula:
APY = (Trailing 7-Day Fees × 52) / Current TVL
Fee split: 75% to JLP (auto-compounded hourly), 25% to Jupiter's protocol treasury.
Fee Breakdown
1. Open/Close Fees — The Biggest Revenue Driver
Current rate: 0.06% per trade on notional position size, charged at both open and close.
Fee history:
- Pre-June 2024: 0.10%
- June 4, 2024 (fee restructure): 0.07% + new price impact fee
- Post-Gauntlet optimization: 0.06%
Opening/closing fees consistently dominate total fee revenue across all reporting periods.
2. Price Impact Fee
Large trades pay an additional fee to prevent pool manipulation:
fee_coefficient = base_fee + trade_size / impact_scalar
| Asset | Impact Scalar |
|---|---|
| SOL | 1,250,000,000 |
| ETH | 5,000,000,000 |
| BTC | 8,000,000,000 |
Example: A 100K SOL position pays ~0.08%. Large traders pay disproportionately more.
3. Borrow Fees — Continuous Hourly Income
Every open position accrues borrow fees to the JLP pool every hour. The rate uses a Jump Rate (dual-slope) model:
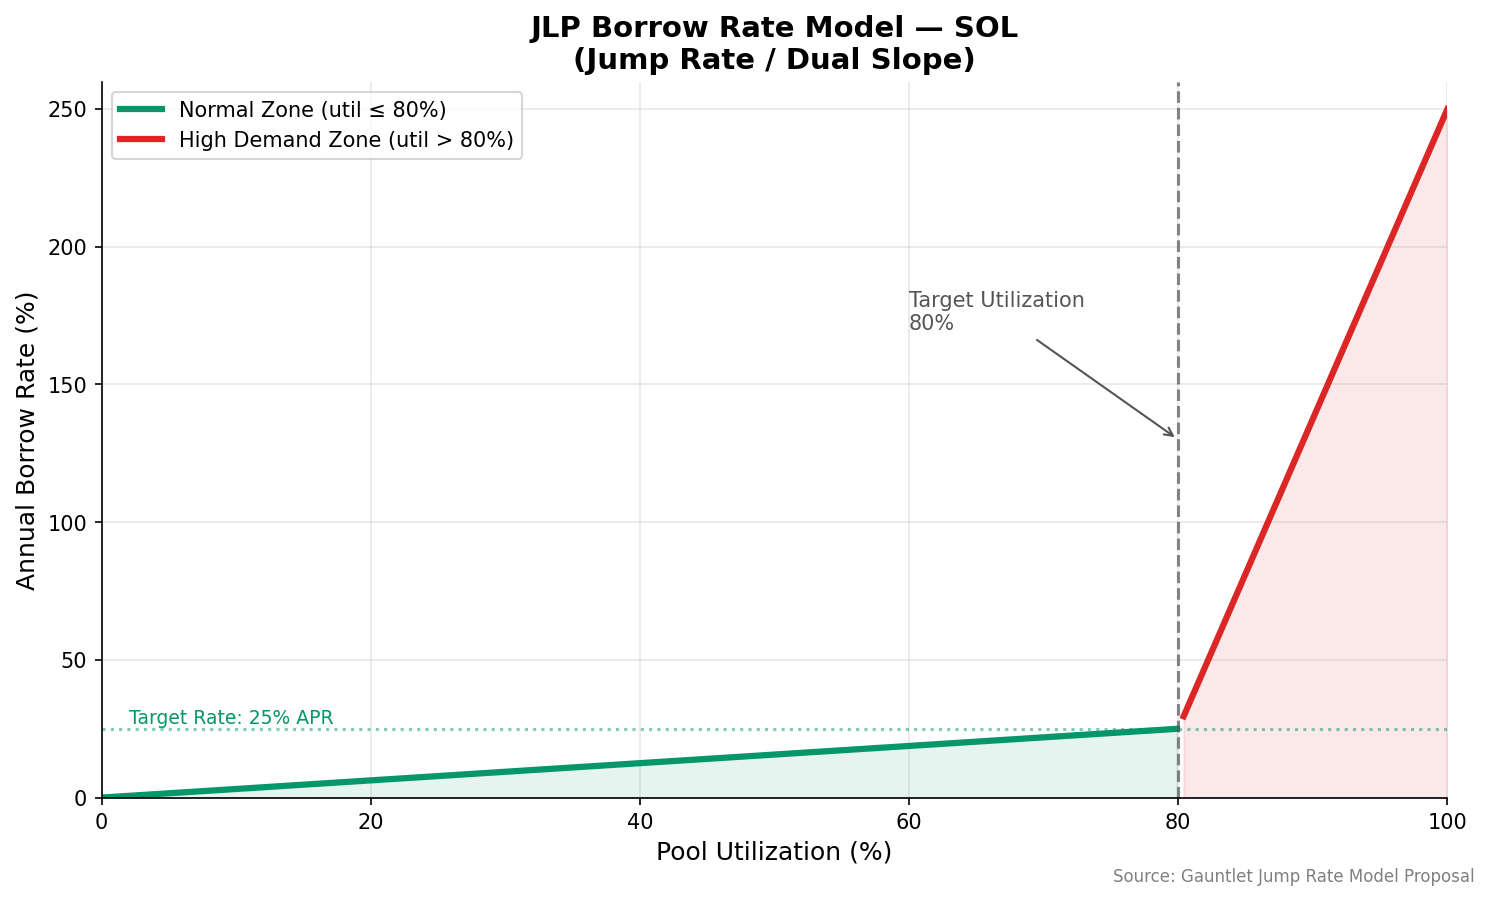
- Below target utilization (≤80%): Rate increases gradually; target APR of ~25% for SOL
- Above target utilization (>80%): Rate jumps sharply; max APR of 250% for SOL
| Asset | Target APR | Max APR | Target Utilization |
|---|---|---|---|
| SOL | 25% | 250% | 80% |
| ETH | 20% | 165% | 80% |
| BTC | 23% | 170% | 80% |
| USDC | 15% | 175% | 80% |
| USDT | 15% | 175% | 80% |
This design ensures: the higher the utilization, the more borrow fee income flows to JLP holders — while also deterring excessive position sizes.
4. Liquidation Income
When a position's effective collateral falls below 0.2% of position size, it gets liquidated. All remaining collateral flows directly into the JLP pool. On August 5, 2024, a single day of global market turmoil triggered over $400M in liquidations — with zero platform downtime.
The Real Structure: JLP Is Short Volatility
With all three components in view, JLP's overall risk profile becomes clear.
Gauntlet formalized the delta of each asset in the pool as:
Δ_a = (spotLiquidity_a − longPerp_a + shortPerp_a + undistributedFees_a) / jlpSupply
Since 90–93.5% of open interest is on the long side, JLP's net position is: long the spot basket, short a synthetic perpetual against all those long traders.
This is structurally identical to selling covered calls:
- Collecting fees = option seller receiving premium (open/close fees + borrow fees)
- Sideways market = best scenario — fees accumulate, traders churn and lose
- Strong bull run = worst scenario — deep in-the-money longs drain pool AUM
- Sharp crash = mixed — spot assets depreciate, but long liquidations return collateral
The analogy: JLP is the casino. Traders pay a cover charge every time they enter. When they win big, they take chips off the table. When they lose, the casino keeps everything. The casino doesn't win every bet — it wins because of fees plus the statistical edge over time.
Risk Factors to Understand
1. Structural Long Bias in OI
With 90–93.5% of open interest long, the entire system has directional risk. Any sustained uptrend that produces profitable traders is JLP's primary risk scenario.
2. Bull Market AUM Erosion
May 7–19, 2024 illustrates this clearly: the underlying basket gained +6.8%, but JLP only gained +5.3% — the ~1.5pp gap came from trader profits being paid out.
3. Liquidity Constraints
Each asset has a ±20% deviation buffer from target weights. If an asset moves too far from target, deposits or withdrawals can be blocked. This can trap capital during market stress.
4. Protocol Concentration and Smart Contract Risk
JLP is a bet on Jupiter as a single protocol. On April 1, 2026, the Drift Protocol vault was exploited — 41.7M JLP tokens (~$155M) were stolen from Drift's vault. This illustrates how building yield strategies on top of JLP introduces additional smart contract layers, each with independent risk.
5. Stablecoin Depeg Risk
USDC and USDT together represent 35% of the pool. A significant depeg event for either would directly impact JLP's NAV.
6. Oracle Dependency
Jupiter uses Edge (Chaos Labs) + Pyth + Chainlink in a 2-of-3 consensus model. The system performed impressively during the August 2024 stress test ($500M+ liquidations in one day), but multi-oracle setups still carry tail risk.
Who Trades on Jupiter Perp?
Volume at a Glance
Jupiter Perpetuals dominates Solana's perp market but remains a minor player globally:
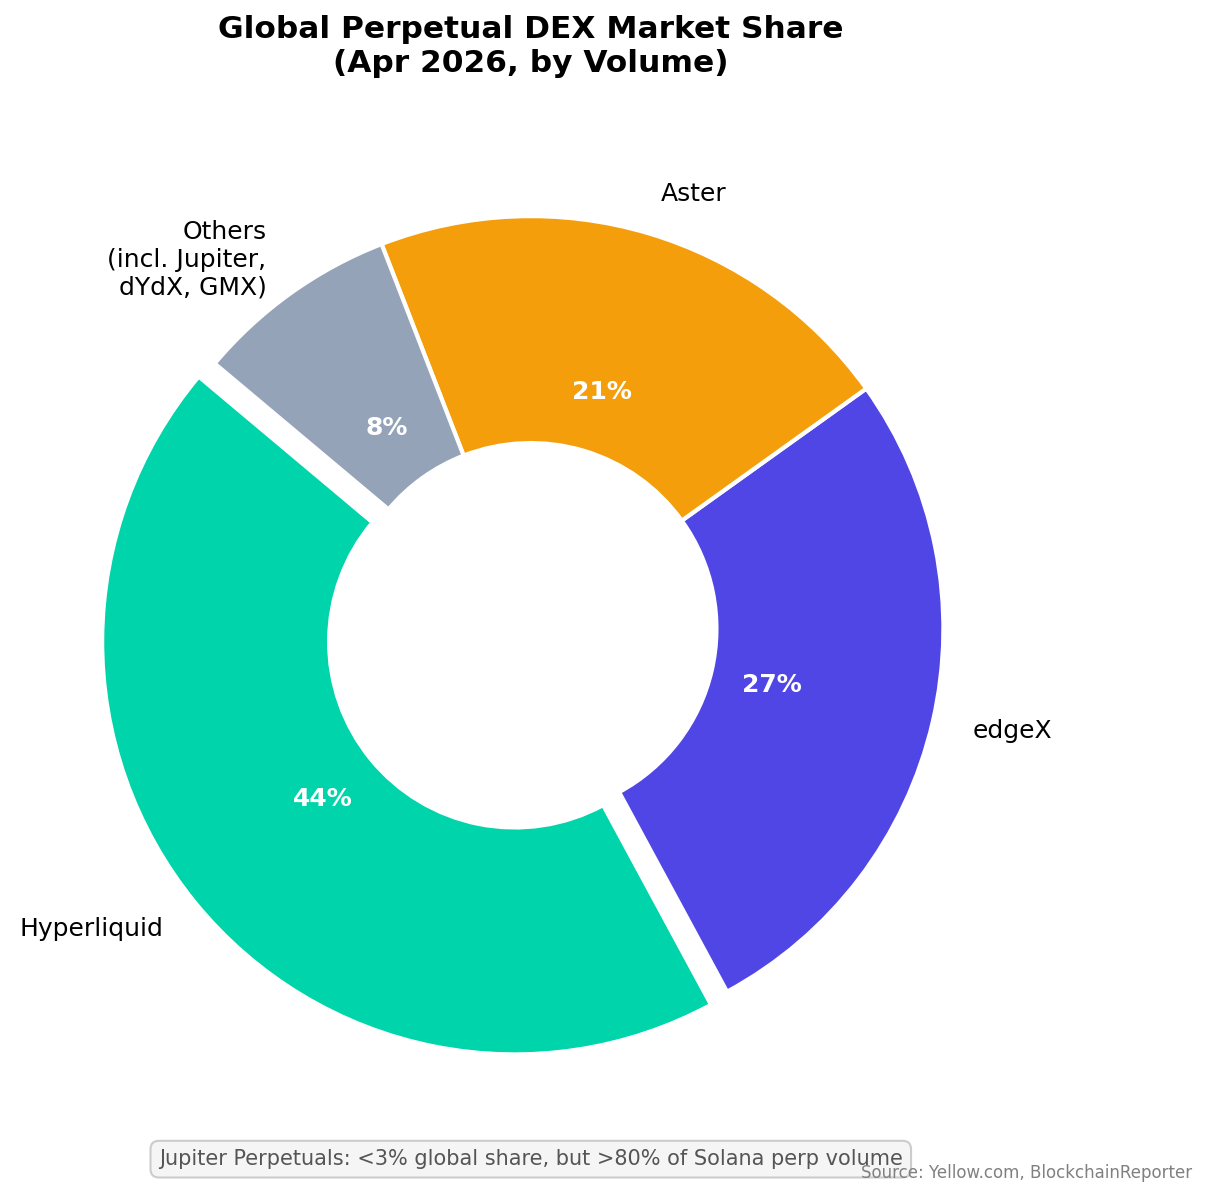
Jupiter holds less than 3% of global perp DEX volume but over 80% of Solana's.
Key metrics:
- All-time cumulative volume: ~$459–472 billion (as of early 2026)
- 2025 annual volume: ~$264 billion
- Daily volume range: typically 495.6M (Feb 10, 2026)
- Asset distribution: SOL consistently 68–77%, BTC ~15%, ETH ~8%
Trader Profile
- Daily active addresses: typically 3,000–10,000; peak 15,000–17,000 (February 2025, extreme volatility)
- Long bias: 90–93.5% of open interest is long — the user base skews toward bullish retail
- Net negative P&L: every weekly report shows traders losing money in aggregate. Jupiter Perp's retail user base is, structurally, the liquidity pool's profit center.
In February 2025, $400M in positions were liquidated in 24 hours without any platform downtime — a meaningful proof of system resilience.
In March 2026, Moonshot International (2M+ mobile-first users) integrated Jupiter Perpetuals — potentially the largest single user acquisition event in the protocol's history.
What the JLP Holder Base Actually Looks Like
Basic Stats
- Total JLP holders: ~64,500–65,000 addresses
- Circulating supply: ~242M JLP tokens
- Market cap (April 2026): ~3.79/token
The Concentration Misconception
"Top 10 wallets hold 80%+" gets cited frequently, but this is deeply misleading. The largest JLP addresses are protocol smart contract accounts, not individual whales:
- Jupiter Perps program vault (the pool itself)
- Kamino Multiply — leveraged JLP strategies at 2–5x, users deposit JLP and borrow USDC against it
- Former Drift vaults — held 41.7M JLP (17% of supply) before the April 2026 exploit
- Gauntlet hJLP — delta-hedged JLP strategy managing ~$140M
- Jupiter Lend (launched August 2025) — attracted 225M
What This Tells You
The JLP ecosystem has matured into a DeFi primitive. Most of the "concentrated" supply is locked in yield strategies and lending protocols, not sitting in individual wallets. The actual retail holder base (~64,500 addresses) interacts with JLP both directly and through these layered products.
Historical Performance: The Numbers
APY Compression Over Time
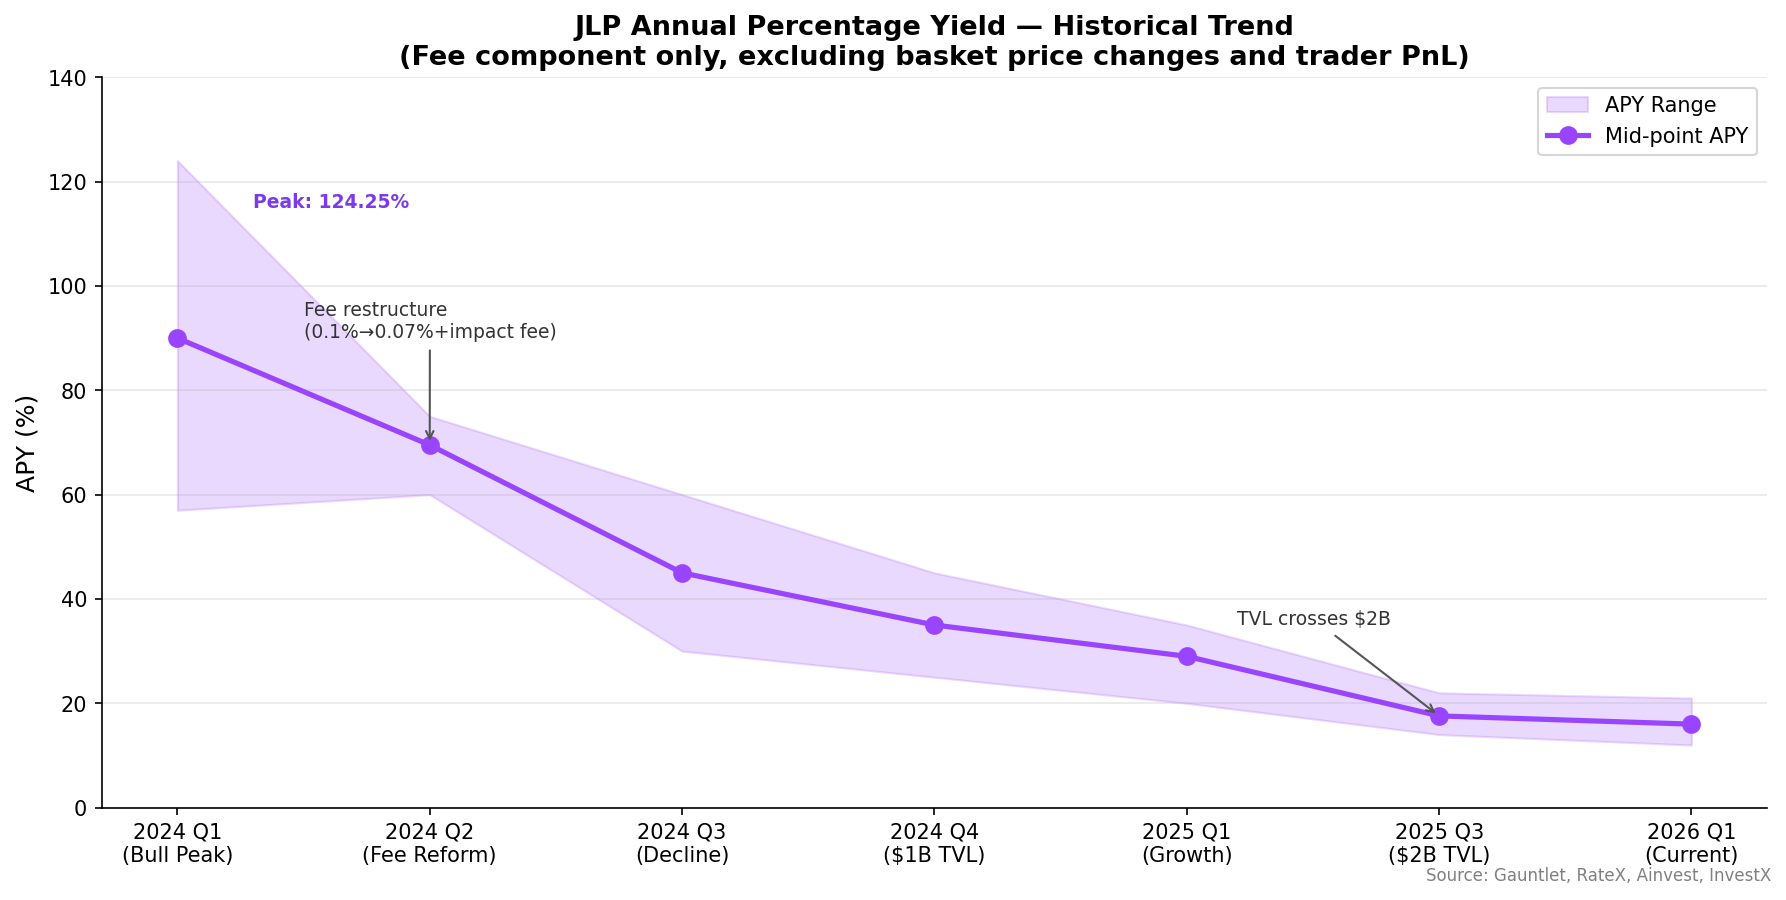
The declining APY story is simple arithmetic: fees haven't grown proportionally with TVL. The pool went from sub-3B+, compressing the yield accordingly.
Head-to-Head vs. Competitors
| Metric | JLP (Jupiter) | GLP (GMX) | HLP (Hyperliquid) |
|---|---|---|---|
| 2024 Full-Year Return | +116% | — | +70% (to mid-2025) |
| Peak APY | 124.25% | 70%+ | — |
| Current APY | 12–20% | 18–26% (historical) | — |
| Sharpe Ratio | 2.93 | — | 4.06 |
| TVL (Apr 2026) | $1.62B | $450M (GLV) | $373M |
| Max Drawdown | -18% (Aug 5, 2024) | — | — |
Key takeaways:
- HLP's Sharpe ratio (4.06) beats JLP's (2.93) because HLP is USDC-only — far lower volatility
- JLP generates higher absolute returns in bull cycles but with more price swings
- In the 2025 downturn: JLP fell ~24% from its 2025 highs while SOL dropped ~55% — significant relative outperformance
- Jan–Aug 2024 P&L summary: traders made 136.8M from fees and trader losses combined
The Bottom Line
JLP is not a simple yield-bearing stablecoin. It's a structured risk product. If you're holding it, you're implicitly doing three things simultaneously:
- Holding a 65% crypto index with SOL as the dominant beta source
- Acting as counterparty to every Jupiter leverage trader — you benefit from their aggregate losses, but a prolonged bull market with profitable traders works against you
- Earning 75% of every fee the protocol generates — the only component in the displayed APY
APY has compressed from 50–124% in 2024 to 12–20% today, driven by TVL growth and increasing competition from Hyperliquid and newer entrants. The structural edge (retail traders losing to the house) remains, but it's now shared across a much larger capital base.
JLP can deliver exceptional risk-adjusted returns in the right environment — high trading volume, choppy markets, aggregate retail losses. But it's not a neutral position. Understanding all three return layers is the minimum required before making a meaningful allocation.
References
- JLP Economics — Jupiter Support Hub — Official fee mechanics, 75/25 split, liquidation logic
- What is JLP? — Jupiter Station — Official docs: three return drivers, APY definition
- Jupiter Perpetuals Fee Structure — Gauntlet — Quantitative fee analysis, pre/post reform APY changes
- Gauntlet Jump Rate Model Proposal — Dual-slope borrow model parameters per asset
- Jupiter Perpetuals Fee & Borrowing Rate Recommendations — Original fee structure recommendations
- Analyzing HLP & JLP Returns — OnChainTimes — 2024 +116% return, Sharpe ratio comparison, -18% max drawdown
- Predicting JLP's APY — RateX on Medium — APY formula, fee composition, 90% long OI ratio
- Why JLP Is Resistant to Declines — ChainCatcher — 3.7M trader gains, August 2024 crash analysis
- Introducing hJLP — Gauntlet — Formal delta definition, hedging strategy
- Perpetual Demand Lending Pools — arxiv 2502.06028 — Academic framework for PDLP delta bounds, $1.5B AUM data point
- Jupiter Weekly Reports — Weekly trader P&L, volume, active address data
- Rapid Rise of Perpetual Trading on Solana — SolanaFloor — 80% Solana market share, $264B 2025 volume
- JLP TVL Surpasses $2B — Ainvest — TVL milestone, 17.58% APY context
- Drift Protocol Exploit — Elliptic — 41.7M JLP stolen from Drift vault
- Jup Lend vs Kamino — Blockworks — JLP as second-largest deposit asset ($225M) on Jupiter Lend
- Global Perp DEX Market Share — Yellow.com — Hyperliquid 44%, Jupiter less than 3% globally
- JLP Price History — CoinGecko — ATH $5.99 (Oct 6, 2025), current price